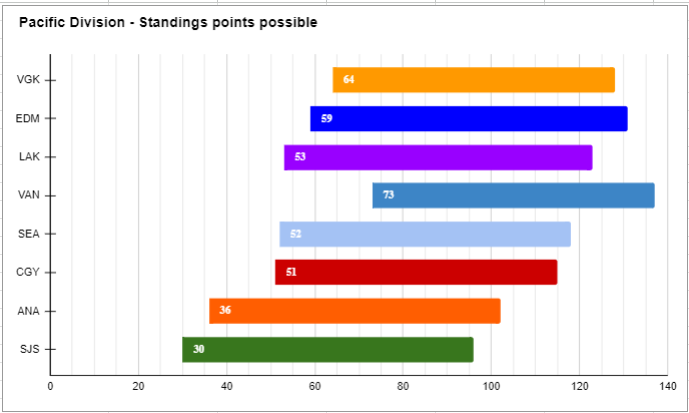

NOW LIVE Playoff time is closing in. If your team only plays .500 hockey the rest of the way, how likely are they to make the playoffs? What would other teams need to do to pass them up? We'll show that here!
NOW LIVE Measures recent performance for a team and shows how that rolling average has changed throughout this (or a prior) season.
Look at any team's seasonal win/loss performance trend for any of the last three seasons.
(Soon, you can compare two teams or seasons on one chart). See how a team compares to others for a season or across different seasons
With Auston Mattews racking up so many goals, we look at goals by age for some of the all-time greats, to see where he and some of the other current players measure up.

COMING SOON Measures the Max and Min points for each team. Visually shows how close a team is from being eliminated, or able/unable to catch a team above it in the standings. Very meaningful near the end of the season!

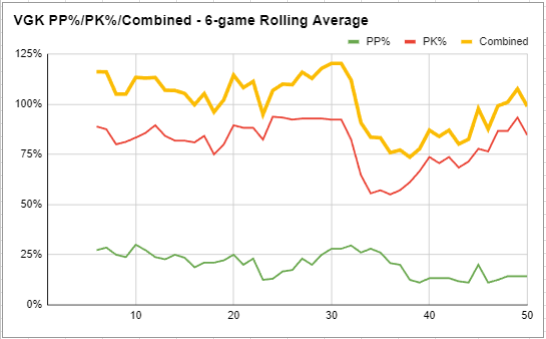
COMING SOON Power Play % and Pentaly Kill % combined and measured over the most recent games